
The Elliott Wave theory is one of the most popular and commonly used technical analysis theories in the investment world. It’s based on the notion that nothing on the stock market is random and that everything happens in patterns that can be interpreted and predicted. One of the core functions of the Elliott Wave pattern is that stock market prices are affected by trader psychology and that the psychological patterns always repeat themselves. But there is more to it than that. On this page, we will give you a comprehensive introduction to the Elliott Wave theory and explain how it works.
$
The Invention of the Elliott Wave Theory
Up until the 1920’s, most investors firmly believed that the stock market behaved in a chaotic manner and that you couldn’t predict the market by only studying prices. In other words, most traders looked at the companies and how they performed more so than the market, they were using fundamental analysis instead of technical analysis. However, this all changed when Ralph Nelson Elliott developed the Elliott Wave Theory in the late 1920’s.
Elliott realized that the market wasn’t as chaotic as everyone thought it was and that, in fact, stock market prices developed in repetitive cycles made up of smaller waves. This was a revolutionary discovery that came to change the way people traded stocks and invested for forever, and Elliott has since been considered one of the pioneers of technical stock analysis.
One of the most prominent users of the theory is Robert Prechter. Prechter used the Elliott Wave Theory, among other things, to predict the market crash of 1987 before anyone else.
So how does the Elliott Wave Theory work? In this article, we’ll give you a quick rundown of the basic concept of the theory. By using this strategy you might find that buying shares get easier.
The Idea of Cycles, Waves, and Fractals
Elliott claimed that the market repeated itself in cycles based on how investors reacted to price changes. He also found that the same patterns showed up for both upward and downward trends and that market cycles could be broken down into smaller waves. Elliott then broke down the wave patterns to smaller fractals – mathematical structures that constantly repeat themselves. In fact, Elliott studied fractals and their behavior long before scientists acknowledged them.
According to Elliott’s theory, there were two types of waves, either an impulsive wave that followed the market trend or a corrective wave that moved against the market. In each impulsive wave, you can find another five smaller waves followed by three corrective waves, and it’s these smaller wave cycles that are always repeating and what Elliott based his theory on.
This system is often referred to as the 5-3 pattern, and each of these patterns becomes a smaller part of the next big 5-3 pattern in a never-ending cycle. As mentioned, the same patterns can be found in both bearish and bullish markets.
Actions and Reactions
Another important part of these investment theories is the idea that every action has a reaction. This means the first five waves are an action and the reaction is always three consecutive corrective waves.
Example:
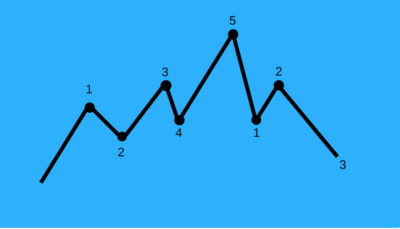
A bullish Elliott Wave Pattern would consist of the following. It starts off with a large increasing price movement (1st impulsive wave), followed by a smaller decreasing price movement (2nd wave), followed by an increasing movement (3rd wave), then a last small decreasing movement (4th wave), and finally a large increasing movement (5th and last impulsive wave). After that, the pattern turns and is followed by a large decreasing wave (1st corrective wave), followed by a small increase (2nd corrective wave), and the pattern finishes with a large decrease (3rd and last corrective wave).
Note that each of these waves is made up of fractals that follow the same pattern.

Wave Categories
Elliott also noticed that waves come in different sizes and he categorized them according to the following sizes.
- Grand Supercycle
- Supercycle
- Cycle
- Primary
- Intermediate
- Minor
- Minute
- Minuette
- Sub-Minuette
How to Best Use the Elliott Wave Theory
This is an often debated subject that most traders have their own ideas about, but generally speaking, it’s good to make use of both the upwards and downwards momentum. Since the theory says that every upwards trend will turn into a downward trend, most investors that use this theory invest in both directions. For example, if you see that a bullish pattern has started on a stock, you long that security for five waves. After the fifth bullish wave you sell the security and short trade it for the coming three waves, and so on.
We would also like to clarify that even though this theory was developed for the stock market it has been applied to other markets as well. It seems like the psychology of investors is similar no matter what securities they invest in. So even though Elliott waves are mostly used for stocks, the theory can apply to other markets as well, for example, cryptocurrency trading.
Besides this theory, any of the best trading platforms today will allow for great analysis with the handy tools that are being offered.
Downsides of the Theory
This is how the theory works in theory, and the above-mentioned examples have been proven to work for thousands of investors. Therefore, we suggest you take advantage of this investment strategy if you think it could work for you as well. However, just like everything else in life, this system is not perfect.
One of the weaknesses of this theory and all other technical investment strategies is that investors who use them tend to blame their own abilities when things don’t work out, instead of the theory itself. This makes it hard to verify the accuracy of technical analysis which is the reason why we always encourage people to combine multiple analyses and not just rely on one.
Also, there is a famous saying that claims that “if you were to put twelve Elliott Wave practitioners in a room, they would fail to reach an agreement on wave count and the direction in which a stock is headed,” meaning that the interpretation is completely personal and might not always agree with everyone else.
A Summary of the Elliott Wave Theory
The Elliott Wave Theory is one of the most popular theories used for technical stock analysis and it is something that every serious trader should have an understanding of. Essentially, the theory claims that stock market prices move in repetitive cycles and that one can study price graphs to find patterns to base their investments on.
In theory, the strategy is easy to understand but it can be quite difficult to apply it properly which is why some investors are reluctant to use it. That being said, investors have used the Elliott Wave Theory to become highly successful, and several of the worst stock market crashes have been predicted using this theory.
Whether you want to use this theory or not is up to you, but it is of the utmost importance that you use some form of analysis and strategy when you invest. To learn more about strategies and investment advice we recommend you check out our education segment.
Find the best trading platform. You capital is at risk when trading. Be careful.
COMMENTS